Cardiology
2017 American College of Cardiology/American Heart Association Guidelines-A Game Changer !!
A new classification of hypertension
Henceforth, SBP >130 mmHg or DBP >80 mmHg would be categorized as HTN. The rationale for such reclassification is provided by a progressive increase in the hazard ratio (HR) of stroke and coronary heart disease as one moves from normal BP to elevated BP (HR – 1.1–1.5) and from there to Stage 1 HTN (HR – 1.5–2.0). A patient whose SBP and DBP values fall in different categories should be assigned to the category with a higher value. The BP readings used for classification should be an average of two or more readings instead of relying on a single value.
Emphasis on accurate measurement of BP
Liberal use of out of office blood pressure – Ambulatory Blood Pressure Monitoring or Home Blood Pressure Monitoring
The guideline advocate use of either form of out of office BP measurement – Home BP monitoring (HBPM) or Ambulatory BP monitoring (ABPM) for both the diagnosis and management of HTN. These recommendations are on similar lines to 2011 NICE guidelines for the management of HTN. Although ABPM is accepted as a better form of out of office measurement and has a large body of data in support, HBPM is a more practical form of measurement. Emerging data support the use of HBPM in achieving better control of BP. Both the methods help in diagnosing 'White coat hypertension' and 'Masked hypertension' in untreated patients. For patients already on therapy, they aid in diagnosing 'White coat effect' and 'Masked uncontrolled hypertension.' The convergence between clinic BP readings and other out of office measurements are given in
Convergent Values of blood pressure measurement by various methods
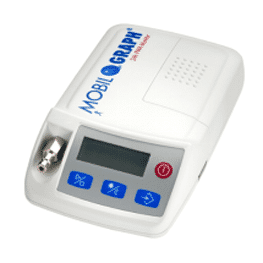
Ambulatory Blood pressure monitoring is a significant tool to determine the hypertensive status of the patient comprehensive before being declared as hypertensive. A medical device with a distinct advantage over the currently available devices with more than 200 studies in the field is now available in India. Mobil-O-Graph ® Pulse Wave Analysis (PWA) is one of the most widely approved and accepted, best devices worldwide when it comes to measuring central Blood Pressure and Arterial Stiffness.
The new MAP C2 measurement algorithm records the Central Blood Pressure better than all other central BP Monitors currently in the market. Combined with HMS (Hypertension Management System)-CS(Client Software), the Mobil-O-Graph®️ PWA device offers innovative, new possibilities within Risk Classification, Diagnostics, and Patient Management.
Advanced Mobil-O-Graph®️ PWA available in India by Sentier for the cases with direct Hypertensive Symptoms as well as for identifying the underlying indications leading to the possibility of being hypertensive in the future.
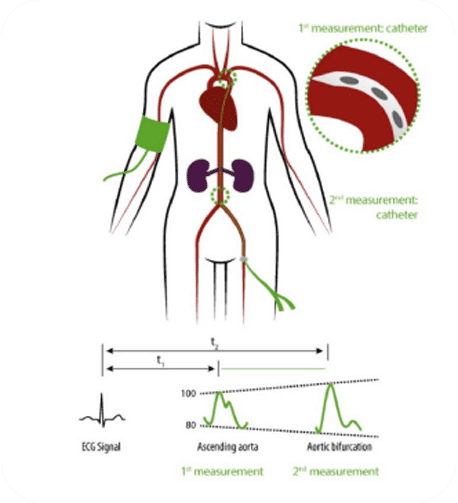
Presently, looking into the rise in hypertensive patients in our day-to-day practice, it becomes imperative to be more intensive in investigations without applying any Invasive Techniques doctors must know in detail about cardiac health in a more comprehensive manner. Available devices, only give an idea about Brachial/Peripheral Blood Pressure, while ascertaining the cardiac health. There are many more vital parameters, required to be taken into account for declaring a patient Hypertensive (As per AHA guidelines). The most important viz. Central BP is being measured by the traditional method, such as Radial Artery Applanation Tonometry, which is expensive and it also requires a highly skilled technician to perform the test. Mobil-O-Graph 24 hours Pulse Wave Analysis (PWA) simplifies the test so that anyone who knows how to apply a BP Cuff can easily perform it. Other than Central Blood Pressure, Mobil-O-Graph®️ PWA also offers precisely: a) Peripheral Blood Pressure, b) Central Aortic Blood Pressure, c) Cardiac Output, d) Peripheral Resistance, e) Augmentation Index, f) Augmentation Pressure, g) Reflection Co-efficient, h) Pulse Wave Velocity.
With a huge amount of benefits and ease of usage, Mobil-O-Graph®️ PWA becomes the choicest device with excellent features:
1) Easy to use, 2) Highly accurate A/A BHS rating, 3) Very comprehensive report generation, small and lightweight, 4) Silent Cuff inflation, 5) Gentle and fast measurement, 6) Auto feedback logic (AFL) prevents discomfort caused by cuff over-inflation, 7)User friendly recorder for patient compliance, 8) Day/Night button for accurate analysis and profile creation, 9) Rapid download of 24hr recording to PC, 10)Result displayed in a wide variety of simple format i.e. numerical and graphical, 11) The patient report can be compared to clearly show, treatment efficacy.
With all technical advantages and detailed descriptions of the cardiac health parameters (Haemodynamics), Mobil-O – Graph ®️ PWA becomes an essential and promising device for each small to mid-size Cardiology unit, as well as to tertiary care cardiology setups in Corporate and Government institutions.

Mobil-O-Graph® PWA
Mobil-O-Graph® NG


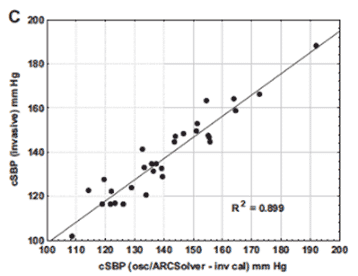
(Millar SPC-454D)
Mean diff 3.0 mmHg
Mobil-O-Graph® 134,9 ± 17,3 mmHg
vs.
invasive 137,9 ± 18,9 mmHg
